PortMind
A six-camera port observatory and vision-model evaluation system, built from 81,202 activity snapshots.
My role
I built the collector, datasets, experiment tooling and review interfaces. Auditing 1,744 benchmark labels revealed that apparently human-reviewed answers came from an agent workflow, so I changed how the system records and verifies its reference answers.
At a glance
6
Cameras observed by the collector
81,202
Activity snapshots · January 28–July 9, 2026, including cached observations
1,744
Historical benchmark labels audited; replacement reference still under review
Build a record of the port
Looking closer at the port
The question was narrow: can a vision model tell whether a truck is carrying a container or towing an empty chassis? I built the collection system, datasets, experiments and review tools. Then an audit showed that labels described as human-reviewed had come through an agent workflow. Fixing that evidence became more important than improving the score.
The starting point was an article from the Montreal Port Authority: Data visibility: a new technological tool for information sharing. It described a port community system that would let shipping lines, railways and operators share operational data in real time. Better visibility would help them coordinate arrivals, plan resources and reduce manual handoffs.
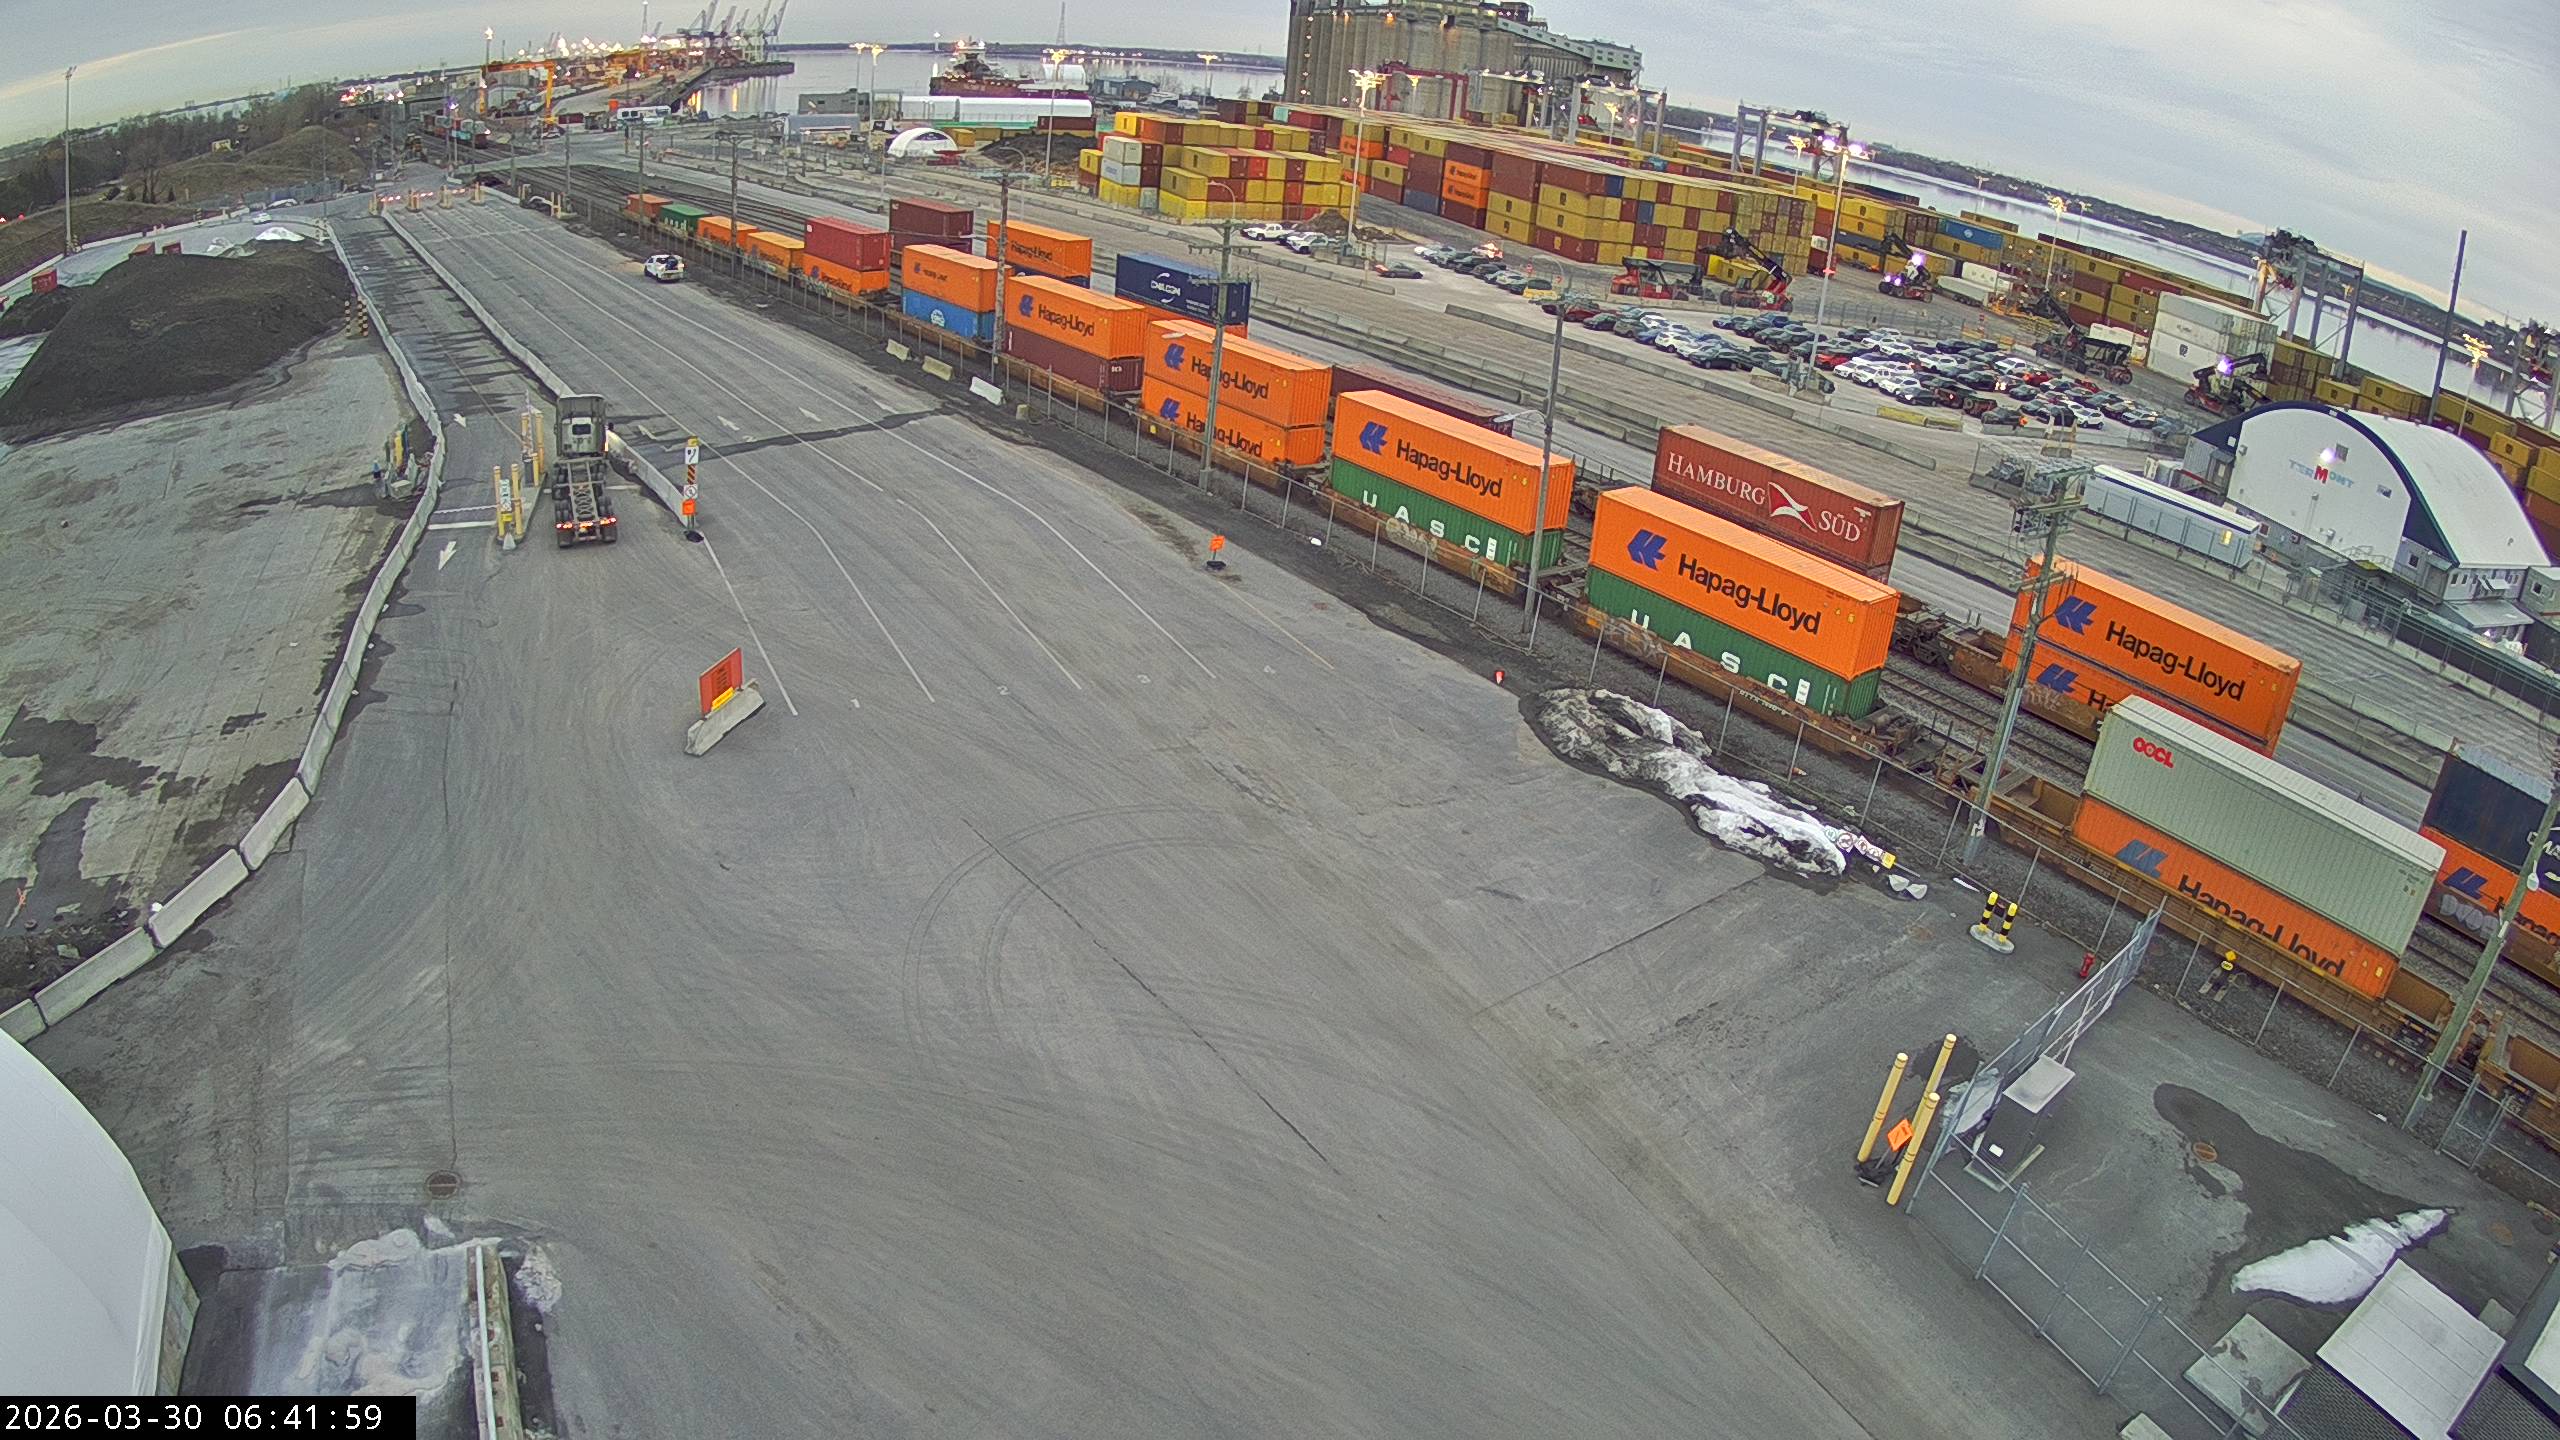
That initiative made me curious about what I could learn from the data already available to the public. I started Port Observatory MTL as an independent project, collecting port camera images alongside vessel activity and schedules. The collection system came first: a way to keep a record of what was happening at the port.
Once I had a record to work with, I wanted to understand how much a vision model could actually tell from it. There are trucks, stacks of containers, shadows and things partly hidden behind other things. Recognizing a truck is one task. Seeing whether it is attached to a shipping container is another. And before I could measure either, I needed to establish what counted as a correct answer.
PortMind became the research project around those questions. My work spans the collection and research tooling, the visual identity, and the interfaces for reviewing images and comparing models.
First, a record to work with
The collector and the research system have different jobs. Port Observatory keeps watching the port. PortMind turns selected observations into datasets and experiments. Keeping that boundary meant I could change a labeling rule or repeat an evaluation without changing the collection process.
A Cloudflare Worker, a small program that runs on Cloudflare’s servers, checks the cameras every three minutes. It rotates through pairs of the six Montréal cameras. An image hash, a fingerprint of the file’s contents, tells it whether a frame has changed. Unchanged frames can reuse the previous observation, marked as cached.
For new frames, DETR, the Detection Transformer, locates vehicles. When enabled, LLaVA, the Large Language and Vision Assistant, then classifies the truck type. These are model predictions. Collecting them does not make them correct labels.
The images live in R2, Cloudflare’s file storage. D1, its managed database, keeps the observation records and collection logs. Each camera records its own outcome, including failures and timeouts. Vessel events and schedules provide context, but do not supply the correct answers for an image evaluation.
Select a step to see the work behind it.
Collect a frame, then check whether it changed.
A scheduled job every three minutes rotates through pairs of Montréal cameras. The collector fingerprints the fetched image, skips repeat inference for unchanged frames, and records each camera’s outcome. Timeouts and cached fallbacks have their own status.
A July 9 inventory recorded 81,202 activity snapshots across the six cameras, with coverage beginning January 28. It also counted 76,353 D1 image rows and 199,214 R2 objects using 36.7 GB. These are different assets, not interchangeable counts of unique photographs. In particular, a cached snapshot is not another independent view of the scene.
The Python tooling builds a manifest, an inventory connecting each observation to its source, camera, time and image file. It also records file fingerprints and produces the lists used for training and evaluation. That lets me trace a result back to the exact inputs instead of relying on a folder name.
From a live map to a research tool
The Observatory’s first commits are from January 19, 2026. It began as a live map. Vessel positions from the Automatic Identification System, the broadcast system used by ships, joined traffic information and terminal schedules. Camera detection and the background collector followed on January 21; truck classification followed the next day.
The early engineering work was about keeping that view useful. On January 24, the database report recorded 72.96 million rows read in a day. Repeated queries were examining far more data than they returned. I added response caching, changed the expensive queries, and reduced polling that was faster than the source updates. Camera collection was split into smaller batches on January 27. These changes addressed specific failures; the report does not establish a measured before-and-after cost saving.
PortMind became a separate repository on June 25. The next steps were a source registry, a read-only connection to the collector, manifests and date-based sampling tools. Then came review packets, simple model comparisons and an experiment registry. The question had shifted from “can I show the activity?” to “can I measure whether the interpretation is right?”
The iteration loop used model mistakes to select the next images for review. This is active learning: spend labeling effort where another answer may be useful. The repository records several rounds of harder examples, image-quality checks, expanded training sets and new comparisons. It also records a later change from the original chronological split tools to the July distribution-matched split, which balanced rows rather than holding out a later period. Those are different evaluation choices.
The experiment registry connected inputs, outputs, file fingerprints, code revisions and summary scores. It was not a complete laboratory notebook from day one. Some early entries have no recorded execution command, refer to uncommitted code, or lack a fingerprint for an output. Later checks began rejecting changed files, overlapping evaluation images and unsupported claims that an agent’s labels came from a human. Keeping that history matters as much as keeping the best score.
The tests cover those contracts: normalizing a source record, respecting date boundaries, detecting an image used in both training and evaluation, rejecting a modified input, and refusing to treat an agent as an independent human reviewer. They check the machinery. A separate human review still has to establish whether the answer itself is right.
Ask a question a model can answer
Trying the smaller model first
Before paying for a larger training run, I tried SigLIP, Sigmoid Loss for Language Image Pre-Training. It turns an image into a list of numbers describing its visual features, called an embedding. I kept that image model fixed. One baseline chose the nearest class average; another learned a small classifier, or head, on the same features. Would learning that decision boundary help?
The July experiment used 1,744 labeled rows: 1,175 to train on, 219 to choose settings, and 350 reserved for evaluation. The score was macro F1: calculate F1 for each class, then average them. F1 balances finding the positive cases with avoiding false alarms, on a scale from zero to one. The learned head reached 0.8584 on validation, then 0.6434 on the test split. The simpler baseline reached 0.6468 on that same test. Adjusting the cutoff for a positive prediction did not help.
| Container-truck classifier | Validation F1 | Test F1 |
|---|---|---|
| Frozen SigLIP · nearest centroid | 0.8493 | 0.6468 |
| Linear softmax head | 0.8584 | 0.6434 |
| Threshold-calibrated head | 0.8584 | 0.6434 |
The learned classifier did not beat the simple baseline on this test. That gave me no evidence to justify a larger training run. The gap between validation and test also needed investigation. Camera and time differences, near-duplicate frames, repeated tuning and label errors were all plausible contributors. This comparison did not tell me which was responsible.
Image size was another question. The model’s full-frame input was reduced to 224 pixels, while people often needed to zoom in to see a distant truck. That suggested testing smaller crops or several image scales. It was a next experiment, not a result I could claim yet.
Making the question visible
I wanted someone arriving on the site to understand the task before seeing a score. The opening image lets them hover or tap an object to see its label. A truck with an empty chassis counts as a container attachment. A stack of containers beside the road does not.
That small interaction does some of the work a long explanation would otherwise have to do. It gives the results a concrete meaning. The rest of the visual identity stays quiet: a compact mark, black type, white space and blue for actions and selection. The camera imagery carries the character of the project.
The scope is deliberately narrow. A still image can show that a truck is present; it cannot establish how long that truck has been waiting. I kept those boundaries in the product language, so a recognition result does not turn into a claim about port traffic.
Check the benchmark before trusting the score
Checking the answers I was scoring against
The most important finding came from the labels. The audit found that every row in the historical locked set had been labeled through Codex, OpenAI’s agent environment, even though the files used human-review field names. Here, Codex identifies the workflow that ran the labeling workers, not a particular model. The reviewer IDs and run report do not establish an exact underlying model version for all 1,744 rows. The files passed their format checks. Their names still overstated the evidence.
I reviewed 120 deliberately difficult training and validation rows and disagreed with Codex on 72. A blind repeat review of those disagreement rows reproduced all 31 clear container-truck positives that Codex had missed. This was a selected hard sample, so it could not estimate an error rate for all port images. It did reveal a recurring kind of miss.
The split also had 84 warnings about images from the same camera taken close together. Similar frames can make a test less independent than it looks. I had also consulted the test results repeatedly during development. I kept those runs as historical diagnostics and stopped treating that split as a final exam. A fixed file and a passing format check were not enough.
The new flow records who supplied an answer, separates model suggestions from independent human review, and checks for overlapping images and camera dates. The September draft starts with 96 verified images across six cameras from June through August. It allows one uncached capture per camera and day, measured in Coordinated Universal Time (UTC), before balancing cameras with a repeatable random seed. It is an initial review packet, not a claim to represent every operating condition.
Does giving a model tools help?
I also explored whether closer inspection helps a model make a better decision. The test harness, the program that runs the experiment, can supply the full image, a three-by-three grid, a crop, and brightness or contrast adjustments. I separated runs where that program chooses the steps from runs where the model calls the tools itself.
The guided July 28 run used a grid followed by the full frame. Those inspection steps were chosen by the wrapper, so every model had zero autonomous tool calls. Calling the run “tool-using” without that detail would make it sound like a different experiment.
| Guided inspection | Agreement | Found / 8 | False alarms / 15 |
|---|---|---|---|
| Grok 4.5 | 73.9% | 2 | 0 |
| Mistral Small 3.1 | 65.2% | 0 | 0 |
| Llama 4 Scout | 65.2% | 0 | 0 |
| Llama 3.2 Vision | 34.8% | 8 | 14 |
| LLaVA 1.5 | 30.4% | 7 | 15 |
The packet began with 20 unique images and four repeat tasks. One undecidable reference task was excluded from binary scoring. Grok had the highest agreement here, but missed six of the eight positive tasks. Mistral and Scout matched the always-No baseline. These results describe this small study; they do not establish a general model ranking.
A separate run required GPT-5.5 to choose and call its own inspection tools. It completed 14 of 24 tasks. That introduced another question: can the model finish the procedure at all? The harness records the actions it requests, requests that fail the expected format, repair attempts, tools actually executed and how the run ends. Those records sit beside the label score.
To establish a benefit from tools, the next comparison needs the same model, images, labeling rules and instructions with and without tool access. Comparing one model with guided crops to another model acting autonomously mixes too many changes. The earlier image-labeling pilot also used a different setup and lacks verified original response traces, so I keep its published scores separate.
A score needs a little context
The results page lets a reader choose a study and a task before comparing models. Each row opens the model’s results within that same context. The study setup sits beside the scores: how many answers were scored, who supplied the reference labels and which images were repeated.
Answers matching the reference across 23 scored tasks. A high score can still hide missed trucks.
 Grok 4.517 / 23
 Mistral Small 3.115 / 23
 Llama 4 Scout15 / 23Llama 3.2 Vision8 / 23
 LLaVA 1.57 / 23
The chart separates finding positive cases from raising false alarms, and it has a table alternative. The denominator and reference source stay close to the ranking. Those details are part of the interface because they change the decision a reader might make from it.
Make the next answer traceable
Helping people give better answers
The reference labels need as much care as the model run. I designed the reviewer flow around two questions: is there a truck, and is a truck carrying a container or towing an empty chassis? Each has Yes, No and Unsure. A reviewer should be able to say that the image does not contain enough evidence.
Zoom, brightness and contrast controls help with distant or poorly lit details. Show original and Reset view give the reviewer a way back. The questions still apply to the whole image, even when someone is inspecting a small part of it.
Before the session, examples and practice introduce the rules. During it, answers remain private and model predictions stay hidden. The organizer can then resolve disagreements before releasing the reference set. That sequence matters: showing a model’s answer too early can influence the label it will later be measured against.
Giving the work a place to live
The workspace brings sources, reference sets, benchmark versions and runs into one place. Its first screen shows what needs to happen next: register the source, review the images and freeze a version. Each step opens the record it belongs to.
The coordinator uses Eve, a framework for agents that can prepare work and follow it through. The web interfaces use Next.js on Vercel. Cloudflare Workflows runs the longer jobs: checking image files, calling models within the approved limits and calculating scores. The database keeps the plan and attempt history; file storage holds the private images and original model responses.
Approval applies to a specific plan: the reference answers, models, instructions, attempt limits and budget. If a request might already have reached a model, retrying must not quietly send it twice. It must not swap models or reuse an old answer either. Failed calls and unsure answers remain visible. Publishing the summary is a separate owner decision.
The same records are available through authenticated Model Context Protocol (MCP), which lets an external agent use the platform’s tools. The coordinator cannot approve spending, finalize human reference answers or publish results. It can help run the work without controlling the answers it will be measured against.
Four ways to mark a port
I explored Harbor Loop, Rhumbline, Hull Wake and Cargo Stack in Paper, testing each in one color and at icon size. Harbor Loop’s open boundary and center point carried forward: a mark about observation that remains legible beside dense review screens.
What the research changed
The early runs gave me useful negative results: a learned head did not beat a simple baseline, apparently reviewed labels were not independent human evidence, and tool access did not automatically mean reliable autonomous inspection. Each changed what I built next.
In September, those command-line steps became a public site, a reviewer app and an agent-assisted workspace. The new Montréal benchmark still needs independent reviews and a finalized reference before its first research results. Small operational checks show that jobs can run through the system; they do not establish model performance.
For a team considering vision models, the value is being able to ask a precise question and inspect the answer: which images, which labels, which mistakes, and under which conditions? My work connects the collection system and experiments to the interface another person uses to make that judgment.
The method and current studies are public. I have also included source notes for this case study with the dates, denominators and historical limitations behind the numbers.
If you are building an evaluation system or applying models to a specific domain, I’d be happy to talk.