I've been building a search engine for 14,822 historical photos from the Montreal city archives. The collection spans the 1920s to the 1990s, mostly 1940s-70s. Aerial surveys, street photography, planning documents, index cards, all of it. Of those, 14,715 images had valid URLs and got CLIP embeddings. All the numbers below refer to that subset.
As part of that I generated CLIP embeddings (ViT-B/32, 512 dimensions) for every image I could fetch and projected them down to 2D with UMAP. I figured I'd see clusters by subject. Churches in one corner, bridges in another, parks somewhere else.
Quick caveat: every distance/spread below is in 2D UMAP space (normalized 0–1). It’s a visualization metric, not a true CLIP-space distance. The numbers are useful for comparisons inside this projection, not absolute similarity.
That's not what happened.
What actually clustered
The strongest signal wasn't what's in the photos. It was how the photos were formatted.
The archive split into two big groups:
| Cluster | Era | Count | What it looks like |
|---|---|---|---|
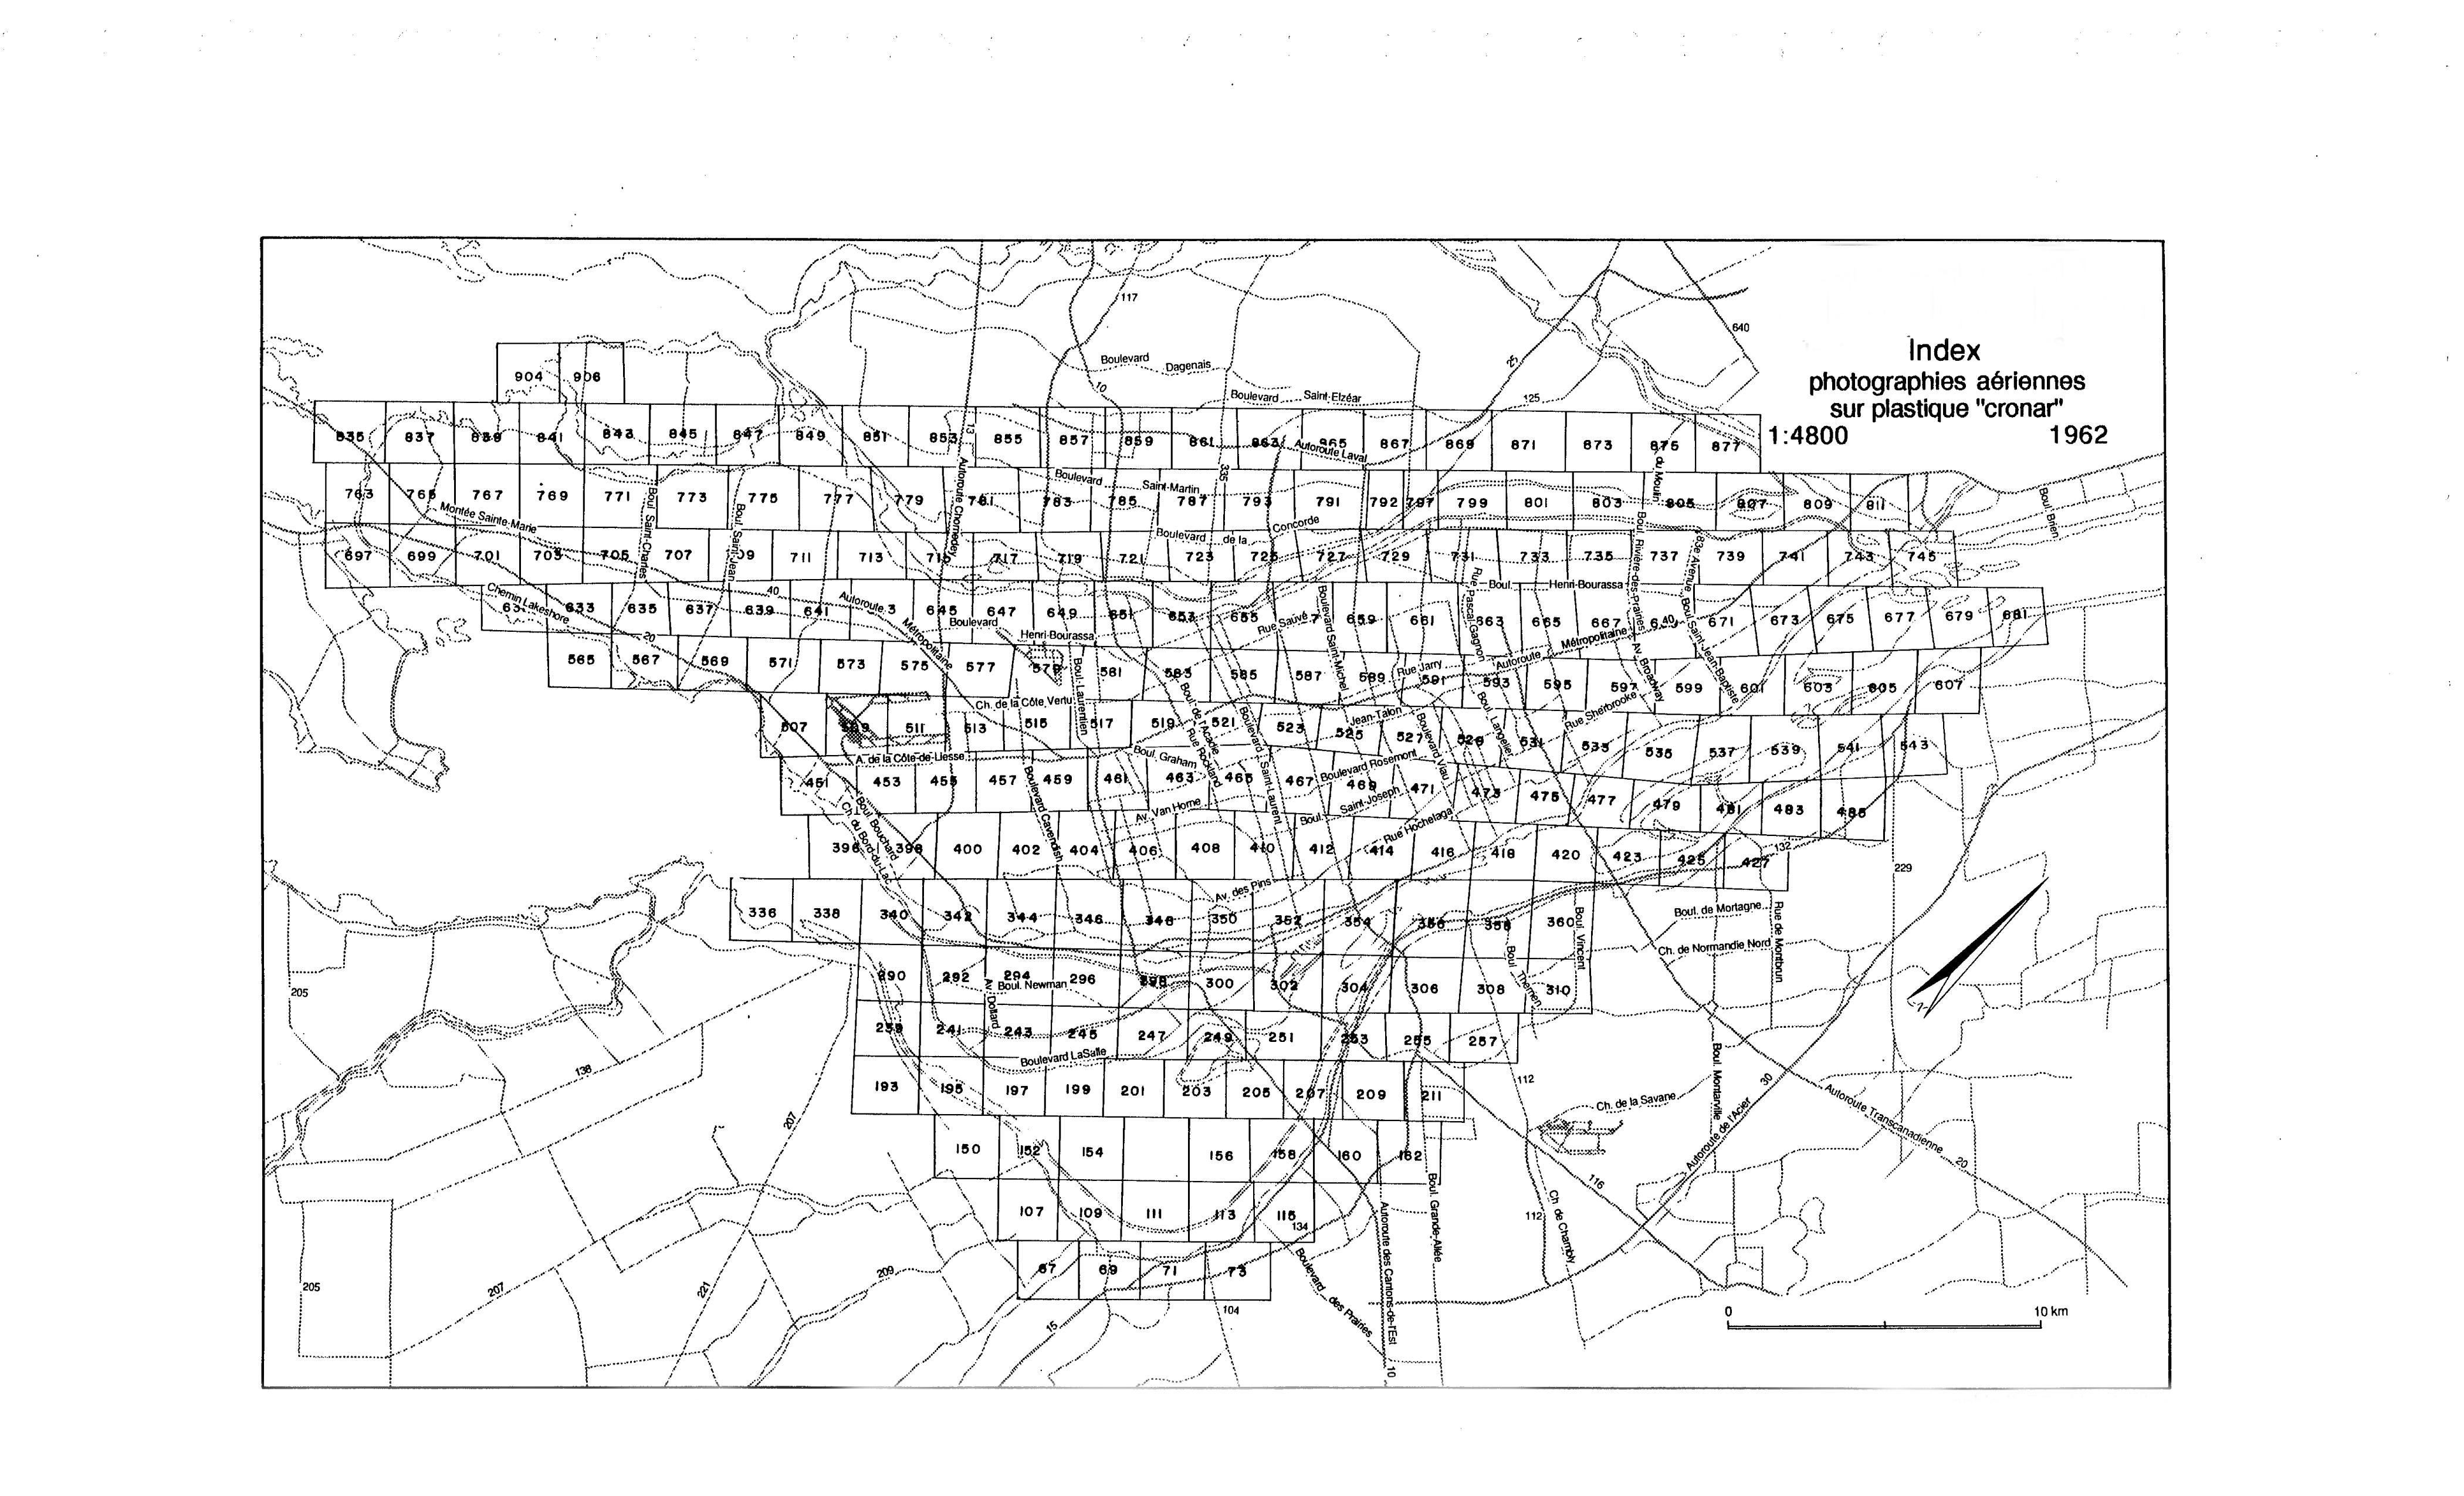
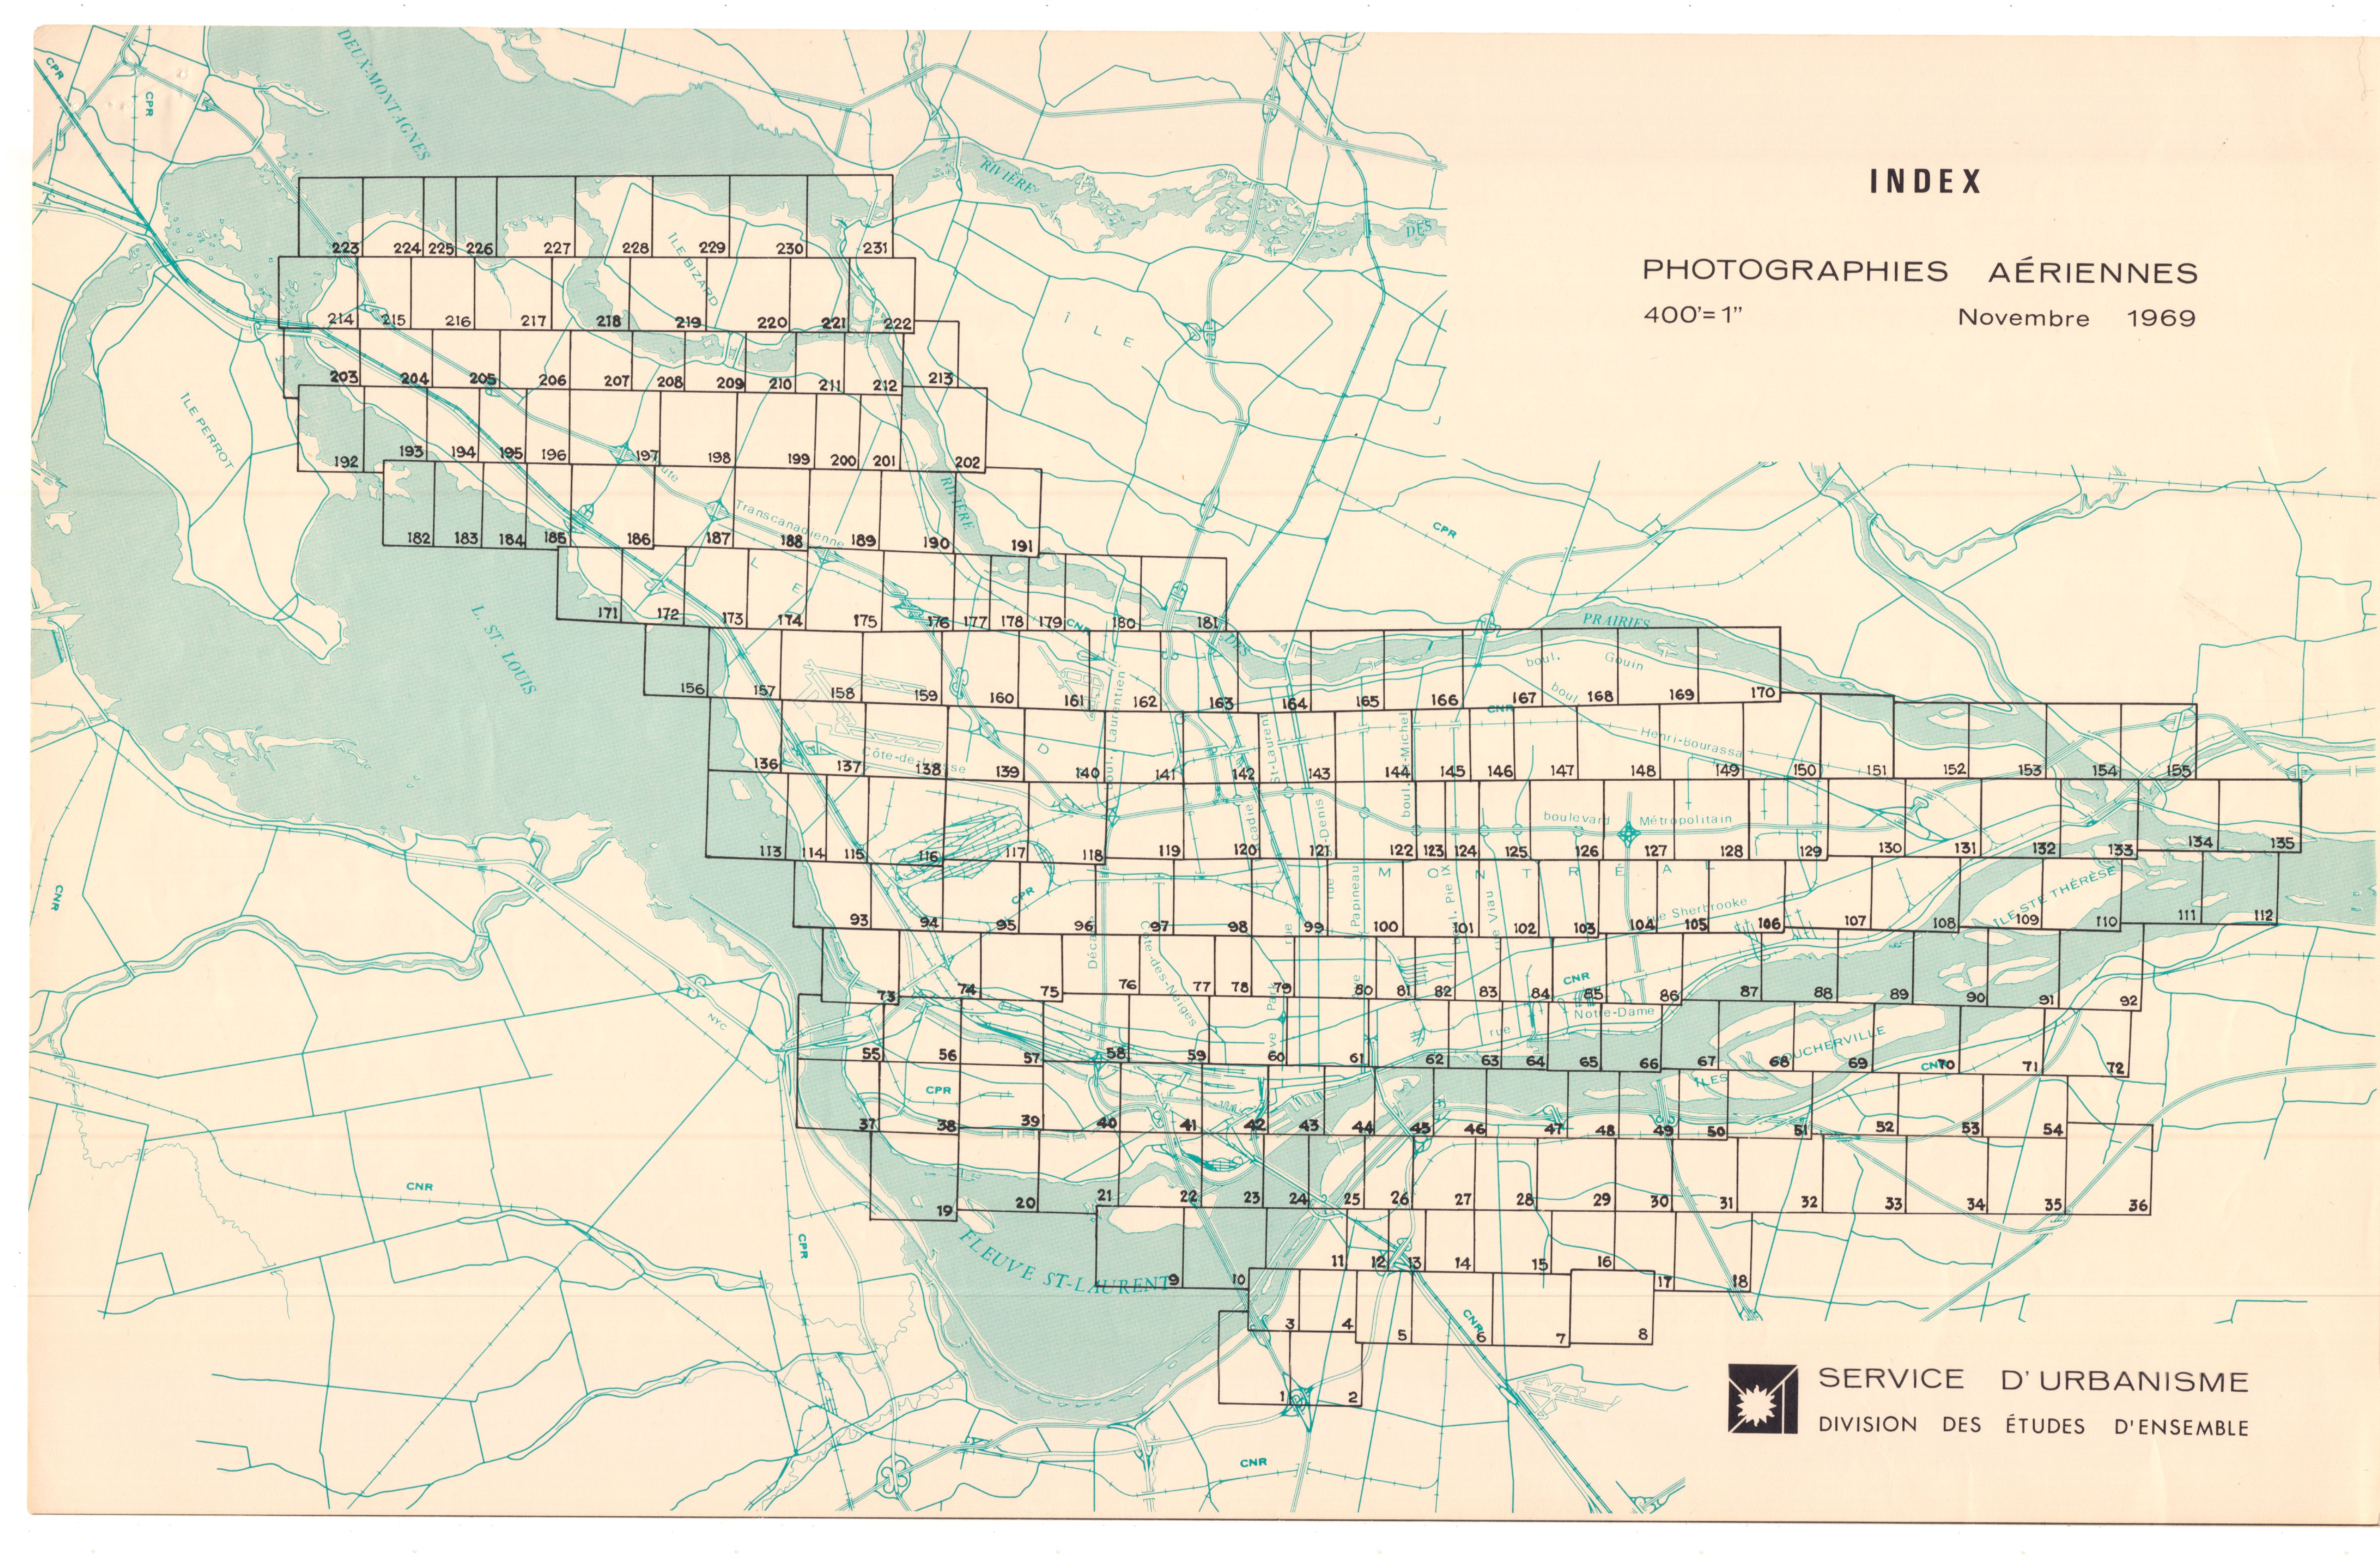
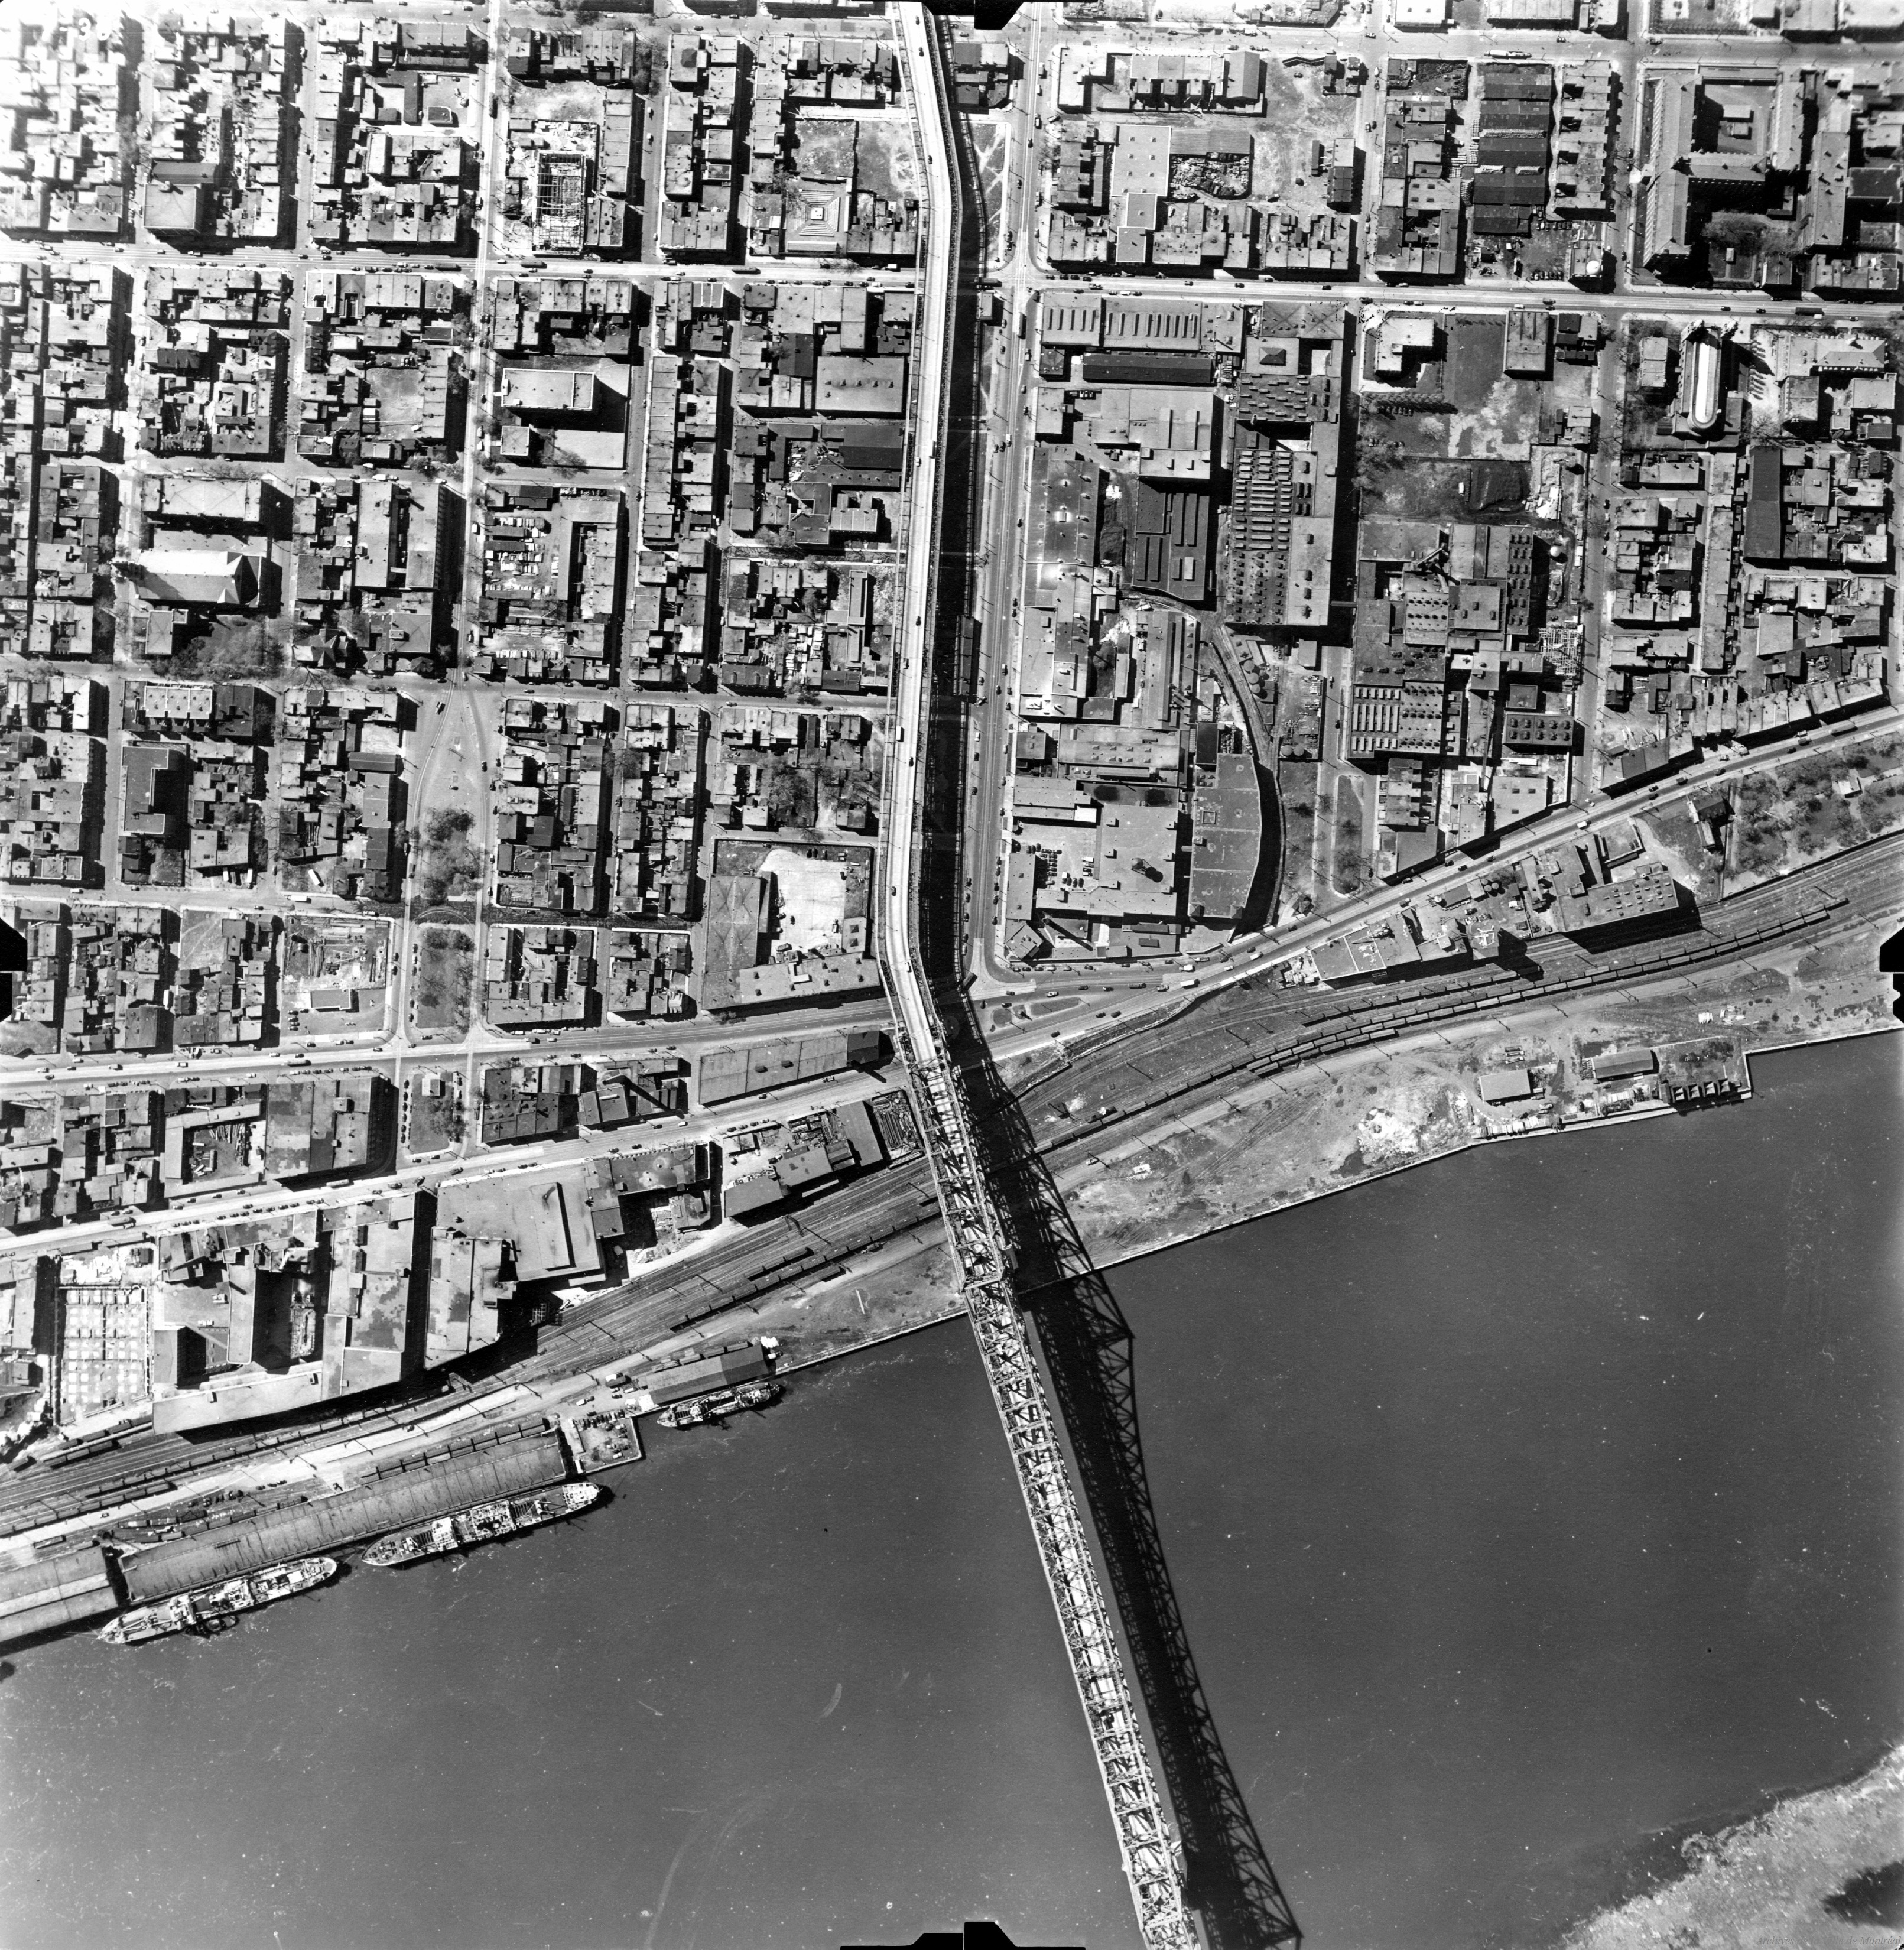
| Lower region (green/blue) | 1940s | 7,805 | Raw B&W aerial photos, no borders, no stamps |
| Upper region (yellow) | 1950s-70s | 2,759 | Official survey documents with "VILLE DE MONTREAL" borders and index numbers |
Separability in UMAP space is near-perfect (≈99% with a simple axis split). Almost every 1940s photo sits apart from every 1950s+ photo. Not because of the content. Because of the border around the image.
Here's what each side looks like:
Both are aerial views of Montreal. But CLIP doesn't care about that. It sees the border, the header, the index number. That's the signal.
The index card wall
The tightest cluster in the whole archive isn't a subject category. It's index cards.
2,781 index cards from the city's planning department cluster with a spread of 0.098 in UMAP space (vs 0.204 for aerial photos and 0.228 for oblique views). Hierarchical clustering pushes that spread down to 0.010. These cards look basically identical to CLIP.
Here's what got me: index cards from the 1950s and index cards from the 1970s are the same thing visually. The closest pair in the entire archive is two index cards 20 years apart, with a UMAP distance of 0.00004.
For context, two random photos from the same aerial flight path average 0.163 in UMAP space. These cards are ~4,000x closer than that.
Bureaucratic formatting doesn't change. At least not in Montreal's planning department.
Seven years apart. To CLIP, they're the same image.
It also detects flight paths
The 7,805 aerial photos from the 1940s aren't one blob. CLIP splits them into sub-clusters that line up with individual flight paths from the original survey.
Using k-means (k=8) on the full dataset, the aerial region splits into sub-clusters. Three of them line up cleanly with flight groups:
| Sub-cluster | Count | Flight groups |
|---|---|---|
| Aerial NW | 2,902 | 7P36, 7P38, 7P26 |
| Aerial Central | 2,125 | 7P17, 7P18, 7P21 |
| Aerial South | 1,623 | 7P40, 7P46, 7P24 |
I checked this with a simple sequence analysis. Consecutive frames from the same flight average a UMAP distance of 0.059. Random frames from different flights average 0.368. That's a 6.2x difference.
Consecutive frames:  0.059  (baseline, UMAP)
Random same-flight:  0.163  (2.75x)
Random cross-flight: 0.368  (6.2x)
CLIP was never trained on aerial survey metadata. It picked up spatial continuity from pixel patterns.
These two look similar to us. But CLIP knows they're from different flights because the ground patterns shift.
Photos from different decades that look the same
I found 1,840 pairs of photos from different decades that land nearly on top of each other in UMAP space:
| Decade pair | Twin pairs | Why |
|---|---|---|
| 1920s and 1940s | 855 | Similar vertical aerial techniques |
| 1940s and 1960s | 598 | Aerial photos vs formatted versions of the same shots |
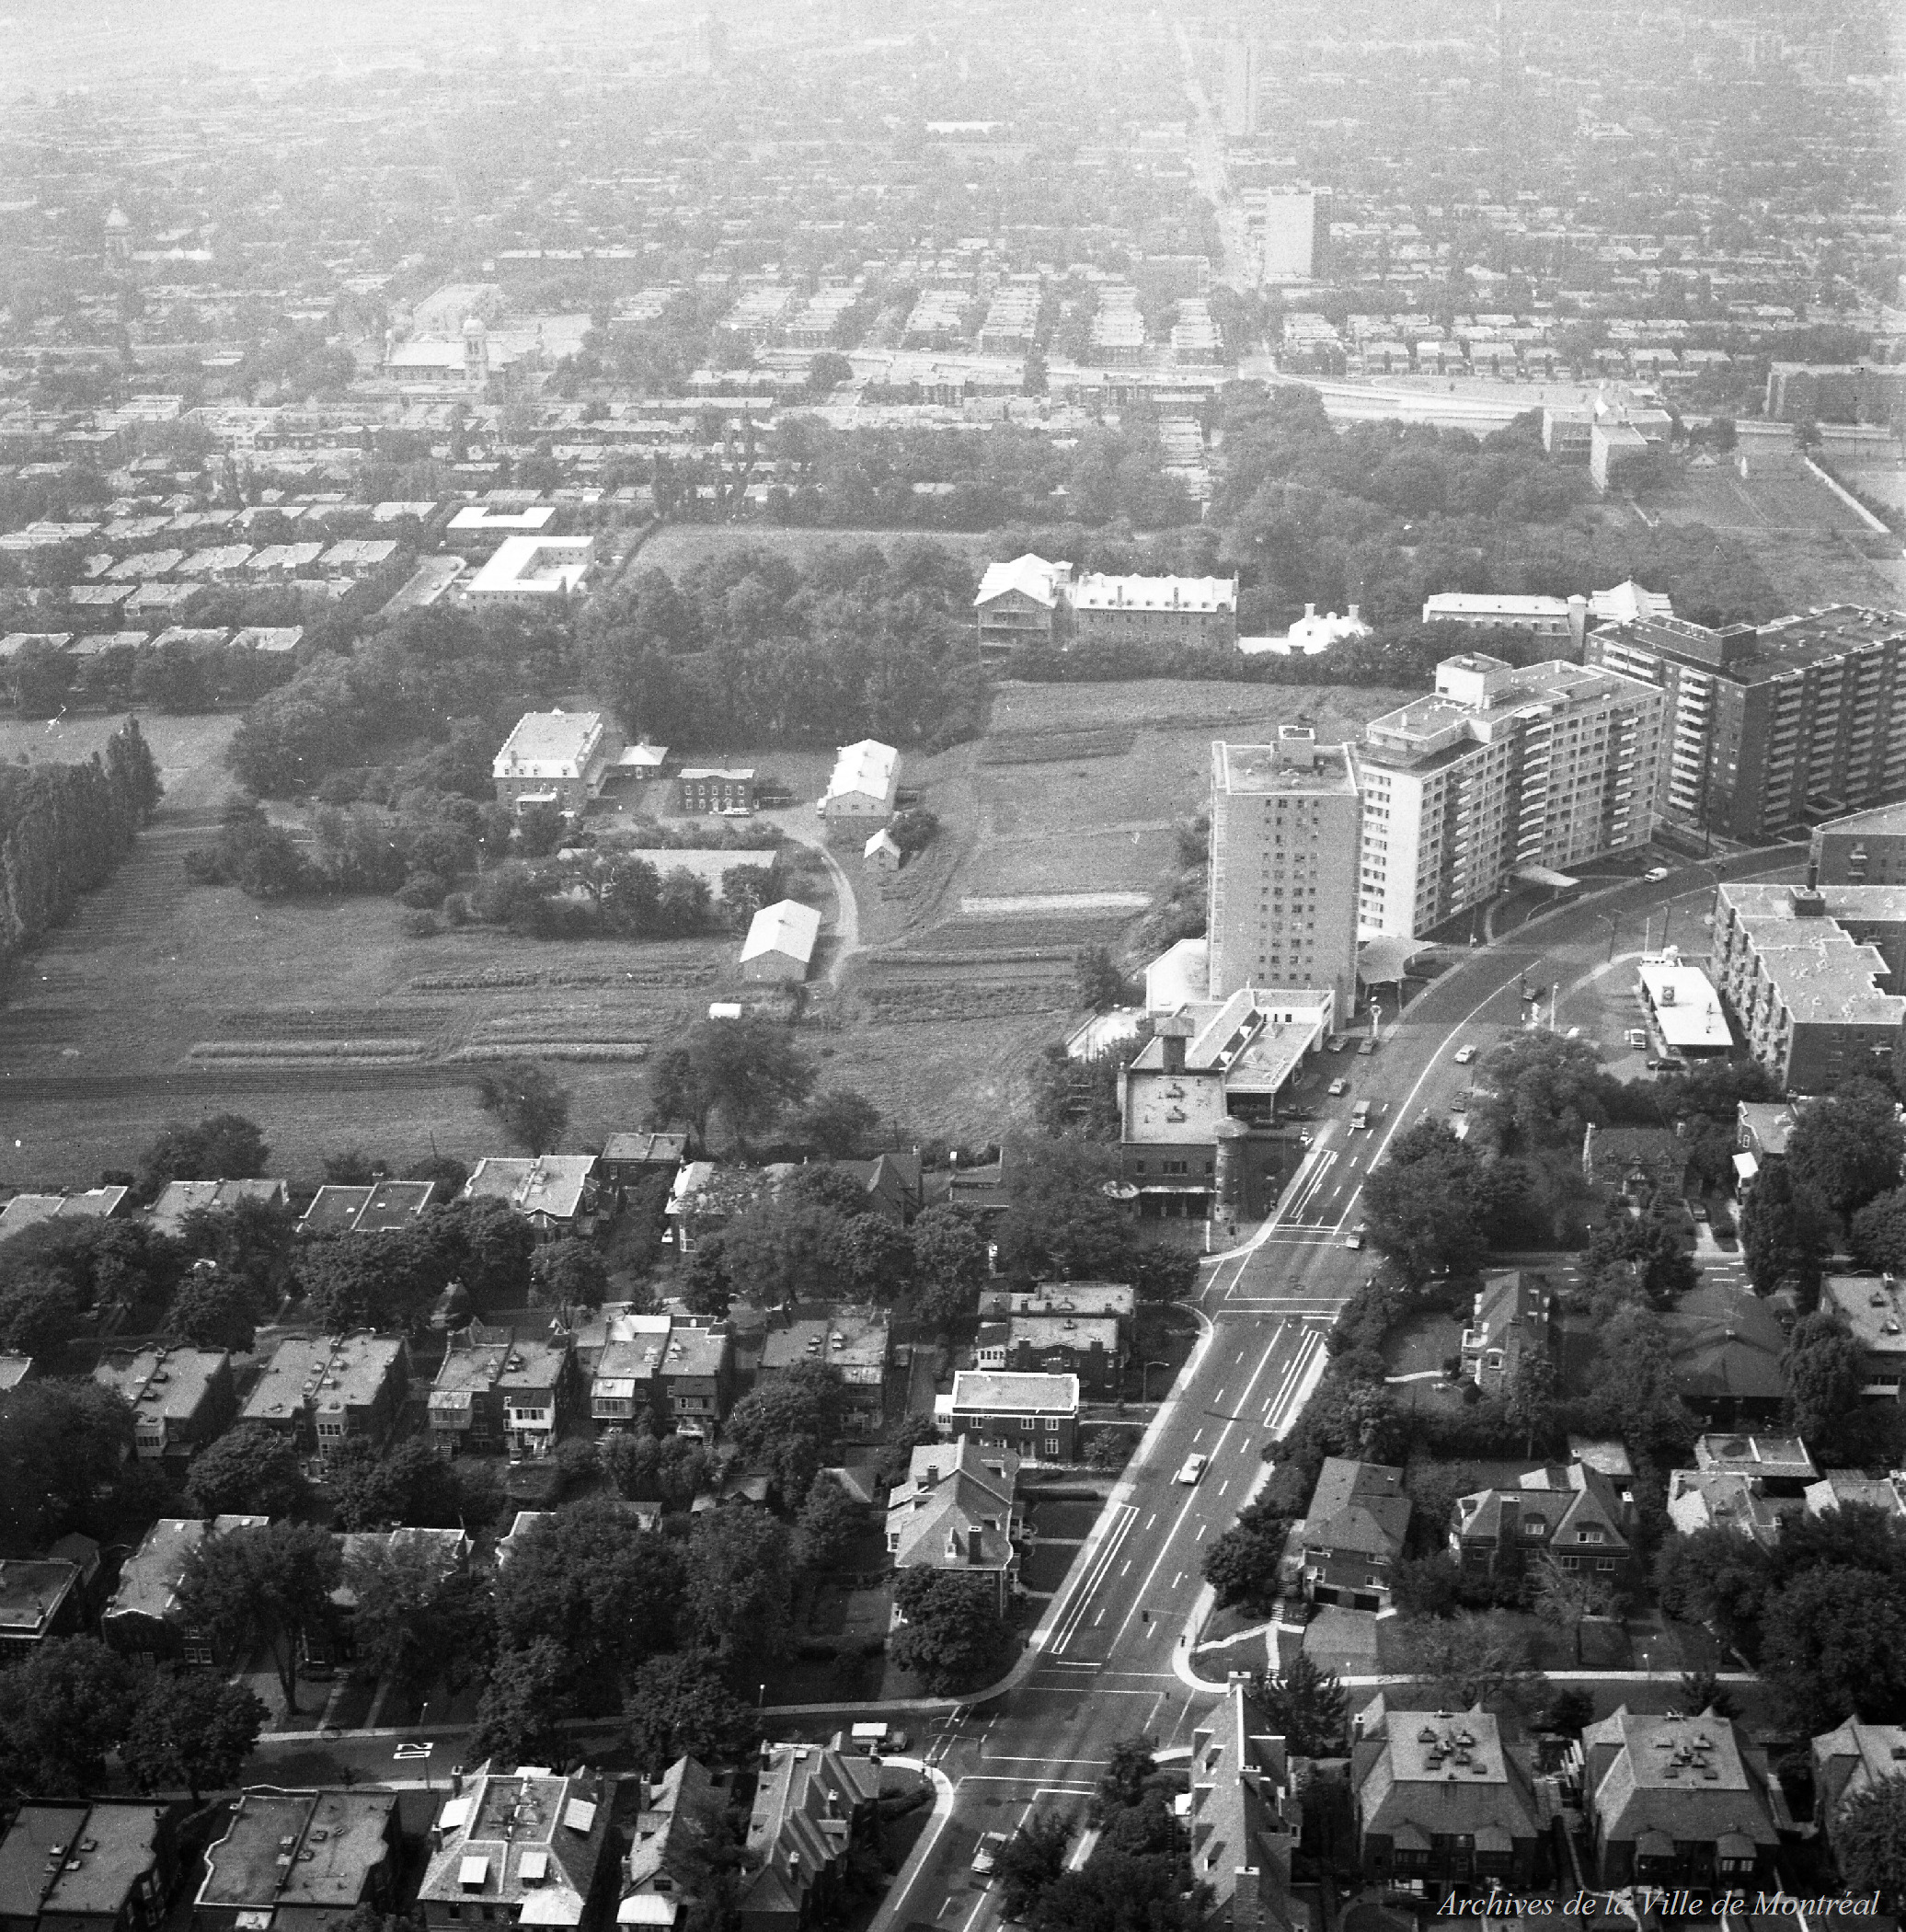
| 1920s and 1970s | 144 | Same oblique technique 50 years apart |
The 1920s-to-1970s twins are interesting. Some oblique aerial photography techniques from the 1920s show up in 1970s photos too. CLIP sees the camera angle and composition, not the decade.
One 1970s photo of the Olympic stadium under construction clusters with 1920s-1940s imagery because it uses the same oblique aerial technique. Modern subject, old photography method.
Photographer fingerprinting
I tested whether CLIP could pick out individual photographers. About 130 photos in the archive have credits.
| Photographer | Photos | Spread | Active period |
|---|---|---|---|
| Henri Remillard | 74 | 0.049 | 1965-1969 |
| Armour Landry | 26 | 0.044 | 1962-1965 |
| Louis-Philippe Meunier | 8 | 0.055 | 1964-1970 |
Remillard and Landry have a centroid distance of 0.022, the smallest of any pair. Their styles are basically identical. Both shot oblique aerials in the early-mid 1960s. Probably colleagues or at least following the same institutional guidelines.
Using a simple nearest-centroid classification I found 20 high-confidence attributions for photos that didn't have credits. All went to Remillard since he has the biggest training set.
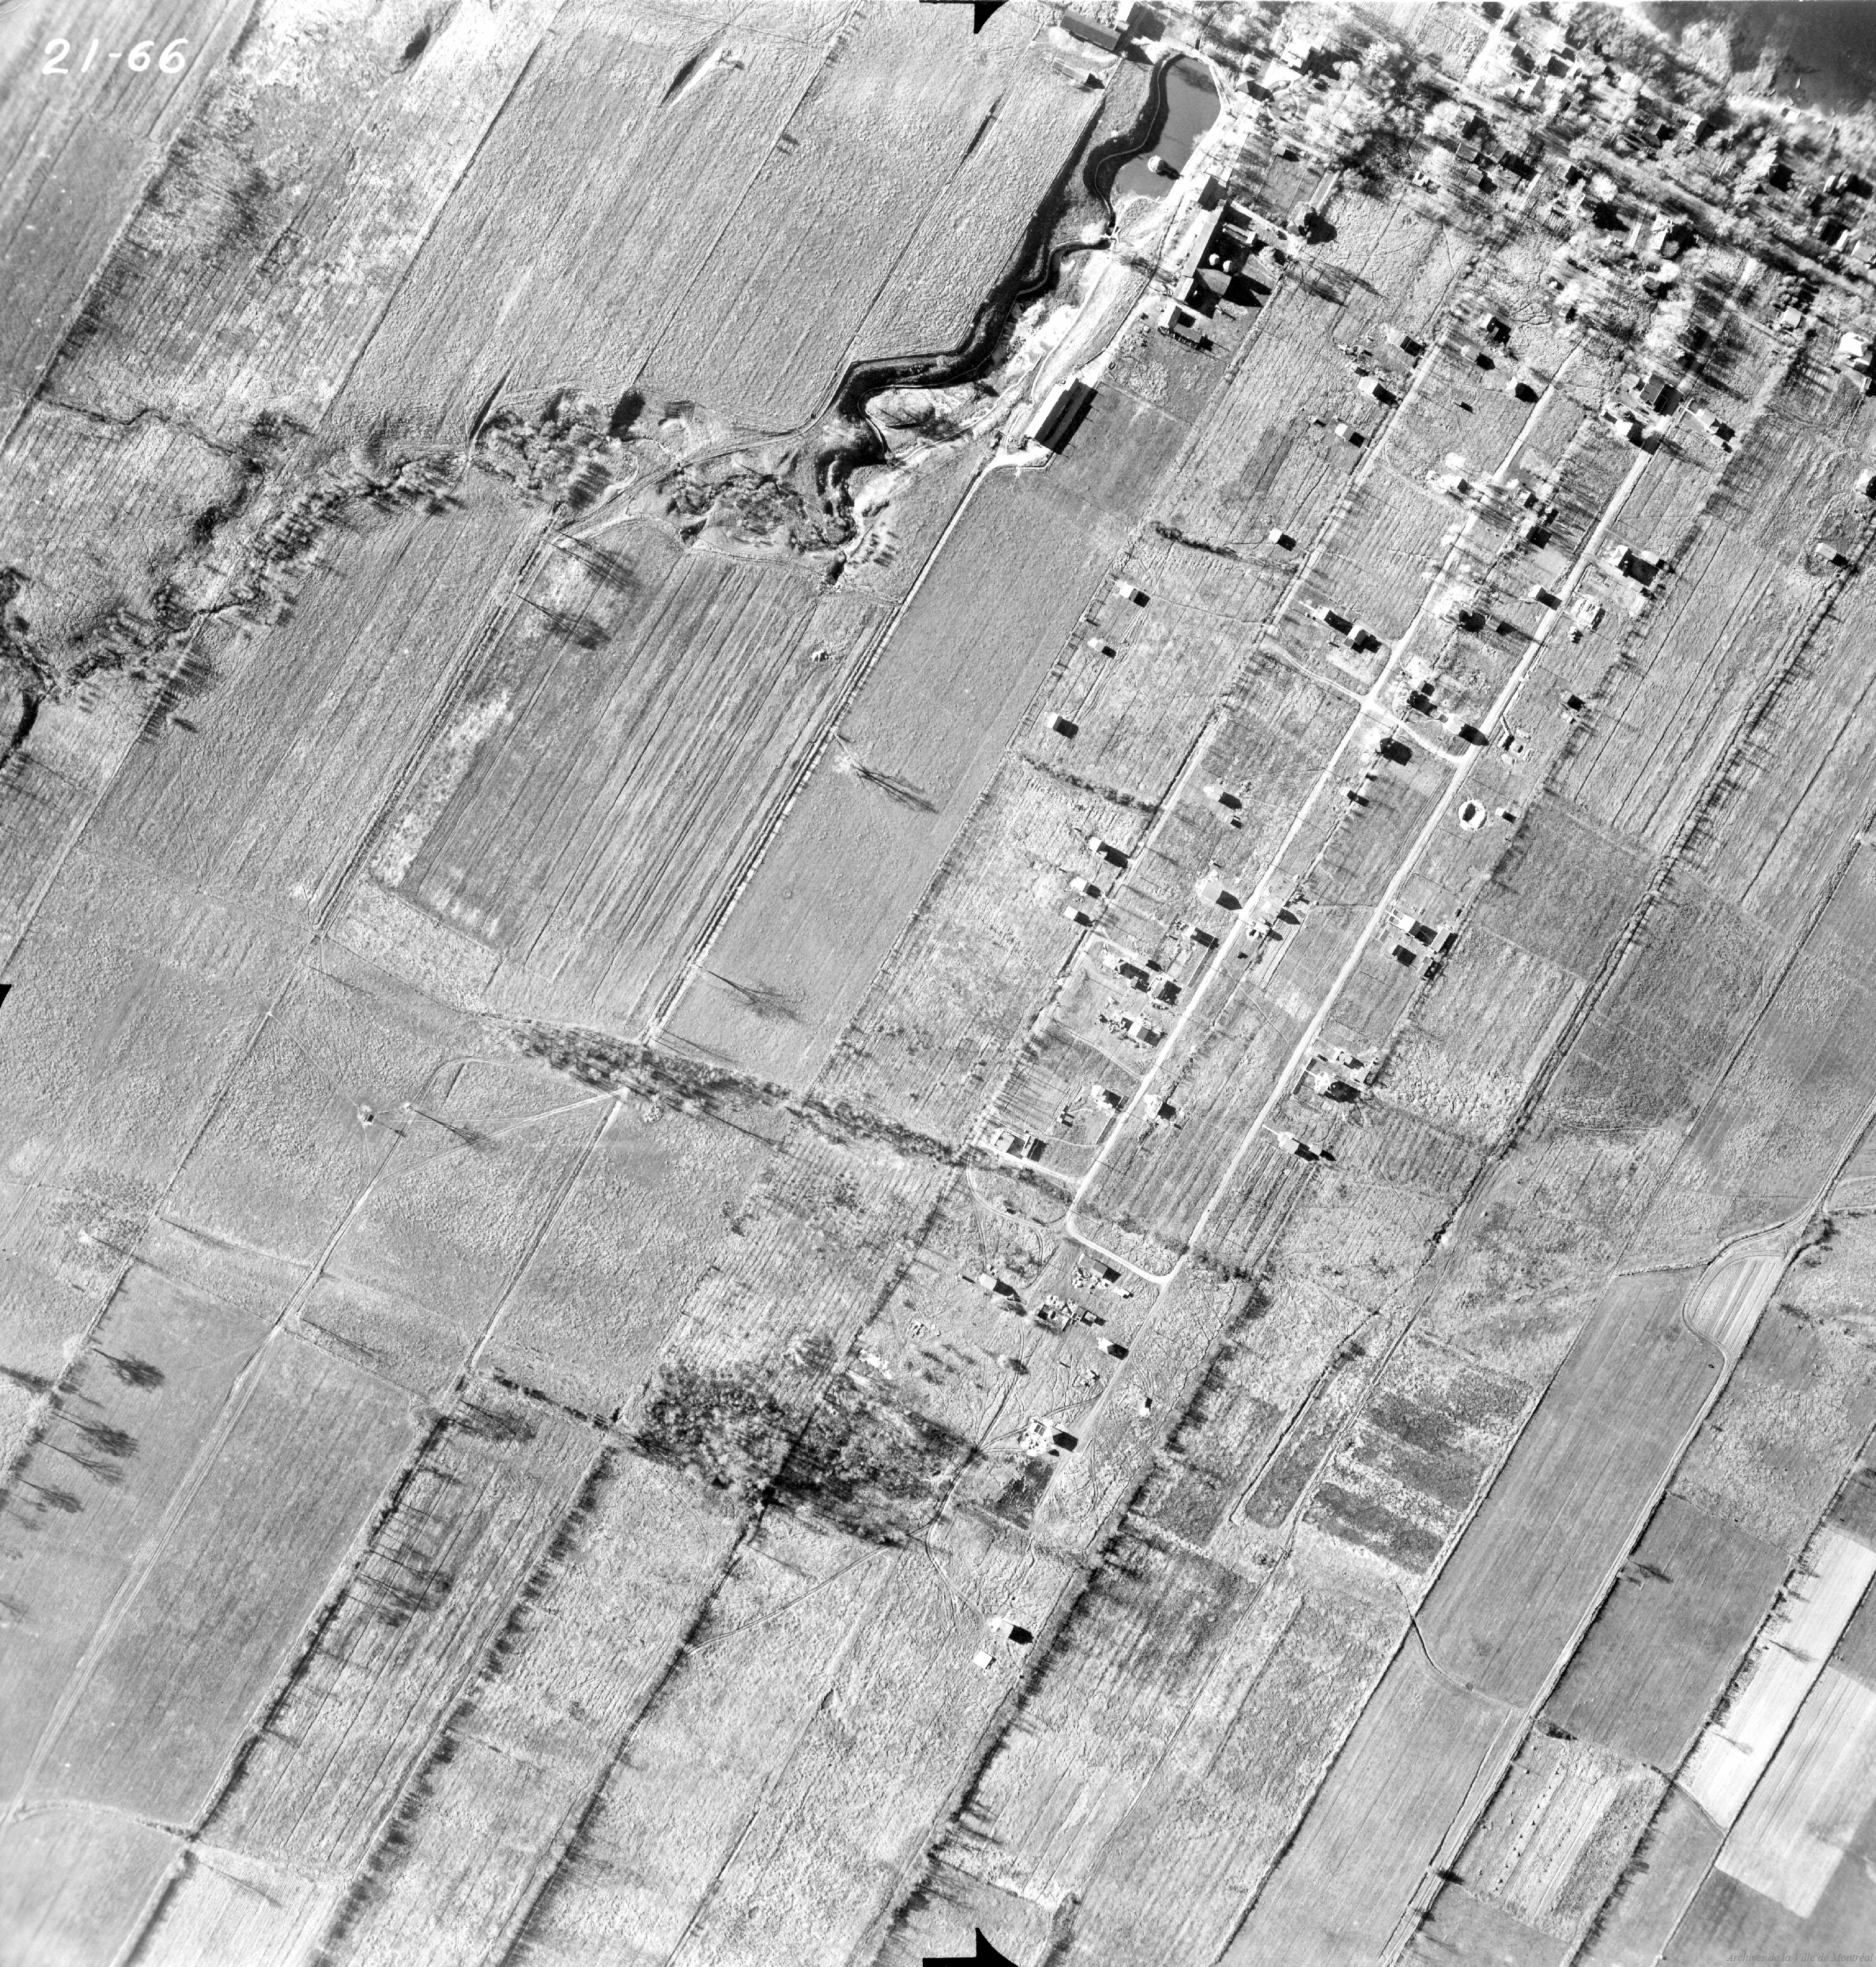
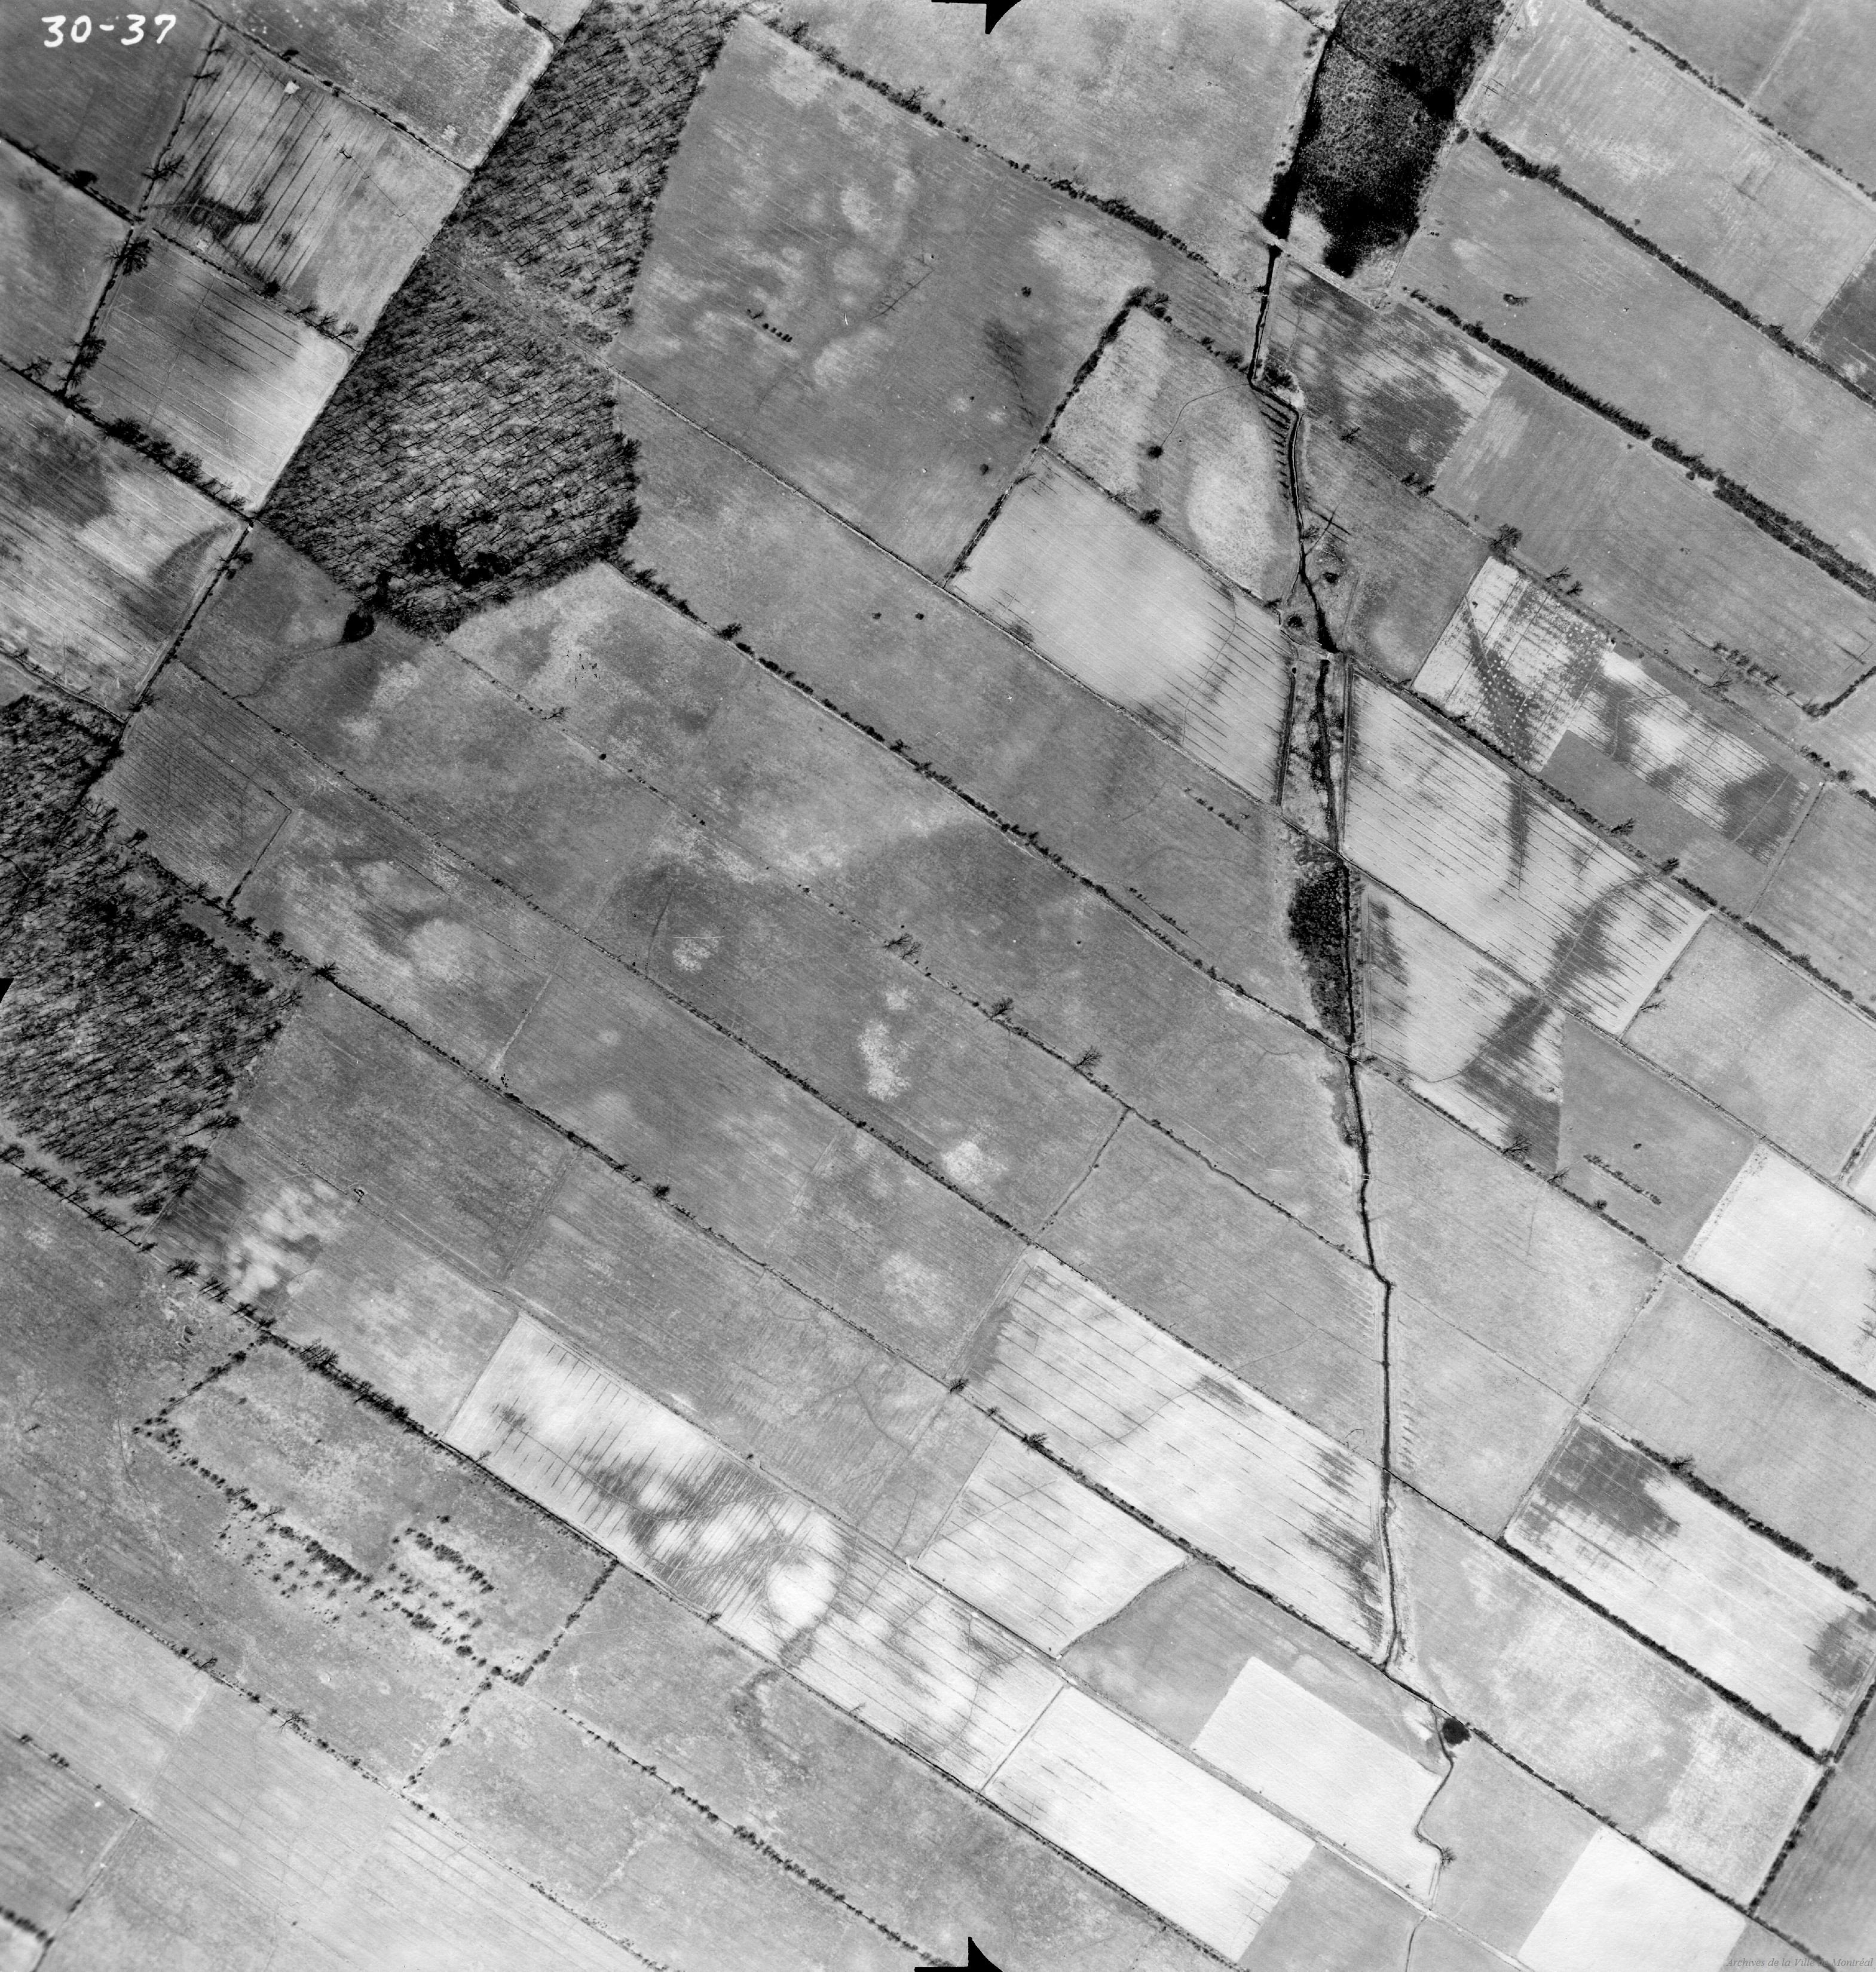
The outliers that aren't broken
I ran a simple embedding-space outlier score (density + edge proximity in UMAP space). Only a handful of extreme outliers surfaced.
I expected damaged or faded photos. Instead the extreme outliers were rural farmland on the edge of Montreal — fields, ponds, agricultural land.
They're not broken. They're the only photos in the archive that show open farmland instead of city. CLIP correctly flagged them as different because farmland doesn't look like cityscapes.
Style beats content
I tested whether CLIP clusters by what's in the photo (semantics) or how the photo was taken (style).
| Category | Photos | Spread |
|---|---|---|
| Streets | 111 | 0.132 |
| Parks | 69 | 0.173 |
| Bridges | 45 | 0.239 |
| Water | 43 | 0.272 |
The silhouette-like score for semantic clustering in UMAP space is 0.18. Barely above random. Meanwhile, formatting-based clustering (documents vs raw photos) gets near-perfect separation.
CLIP doesn't primarily see "bridge" or "park." It sees "1940s aerial with no border" or "1960s planning document with institutional header."
What I took away from this
Your vision model knows things you didn't teach it. CLIP was trained on internet image-text pairs, not archival documents. It still figured out that government formatting is a stronger visual signal than what's actually in the photo. If you're using CLIP for search or classification, check what it's actually clustering on. It might not be what you think.
Institutional consistency is powerful. Index cards from different decades look the same to CLIP. That means you could do document-type classification with very little training data. One example of an index card basically gives you all of them.
Consecutive frame detection works out of the box. If you have sequential imagery (surveillance, aerial survey, time-lapse), CLIP embeddings already encode spatial and temporal continuity. No fine-tuning needed. The 6.2x distance ratio between same-flight and cross-flight frames is more than enough for automated sequence detection.
Outliers in clean datasets usually mean something. Don't assume outliers are errors. The outliers that didn't fit weren't damaged. They were the only rural farmland in an urban archive. The model was right to set them apart.
Photography techniques outlast the decades. A 1970s photo can look like a 1920s photo if it uses the same camera angle and composition. This matters for any model doing temporal classification. Date metadata alone isn't reliable.
Methods note. All distances/spreads/centroids here are computed in 2D UMAP space (normalized 0–1), not in raw CLIP embedding space. UMAP is for visualization; changing its parameters shifts absolute distances but the qualitative separations above stayed consistent in my runs.
You can explore the archive at mtlarchives.com and the code is on GitHub.